Sentiment & Position
Beyond whether your brand appears, Quratic tracks how it appears: the tone of the mention (sentiment) and where in the response it occurs (position).
Sentiment
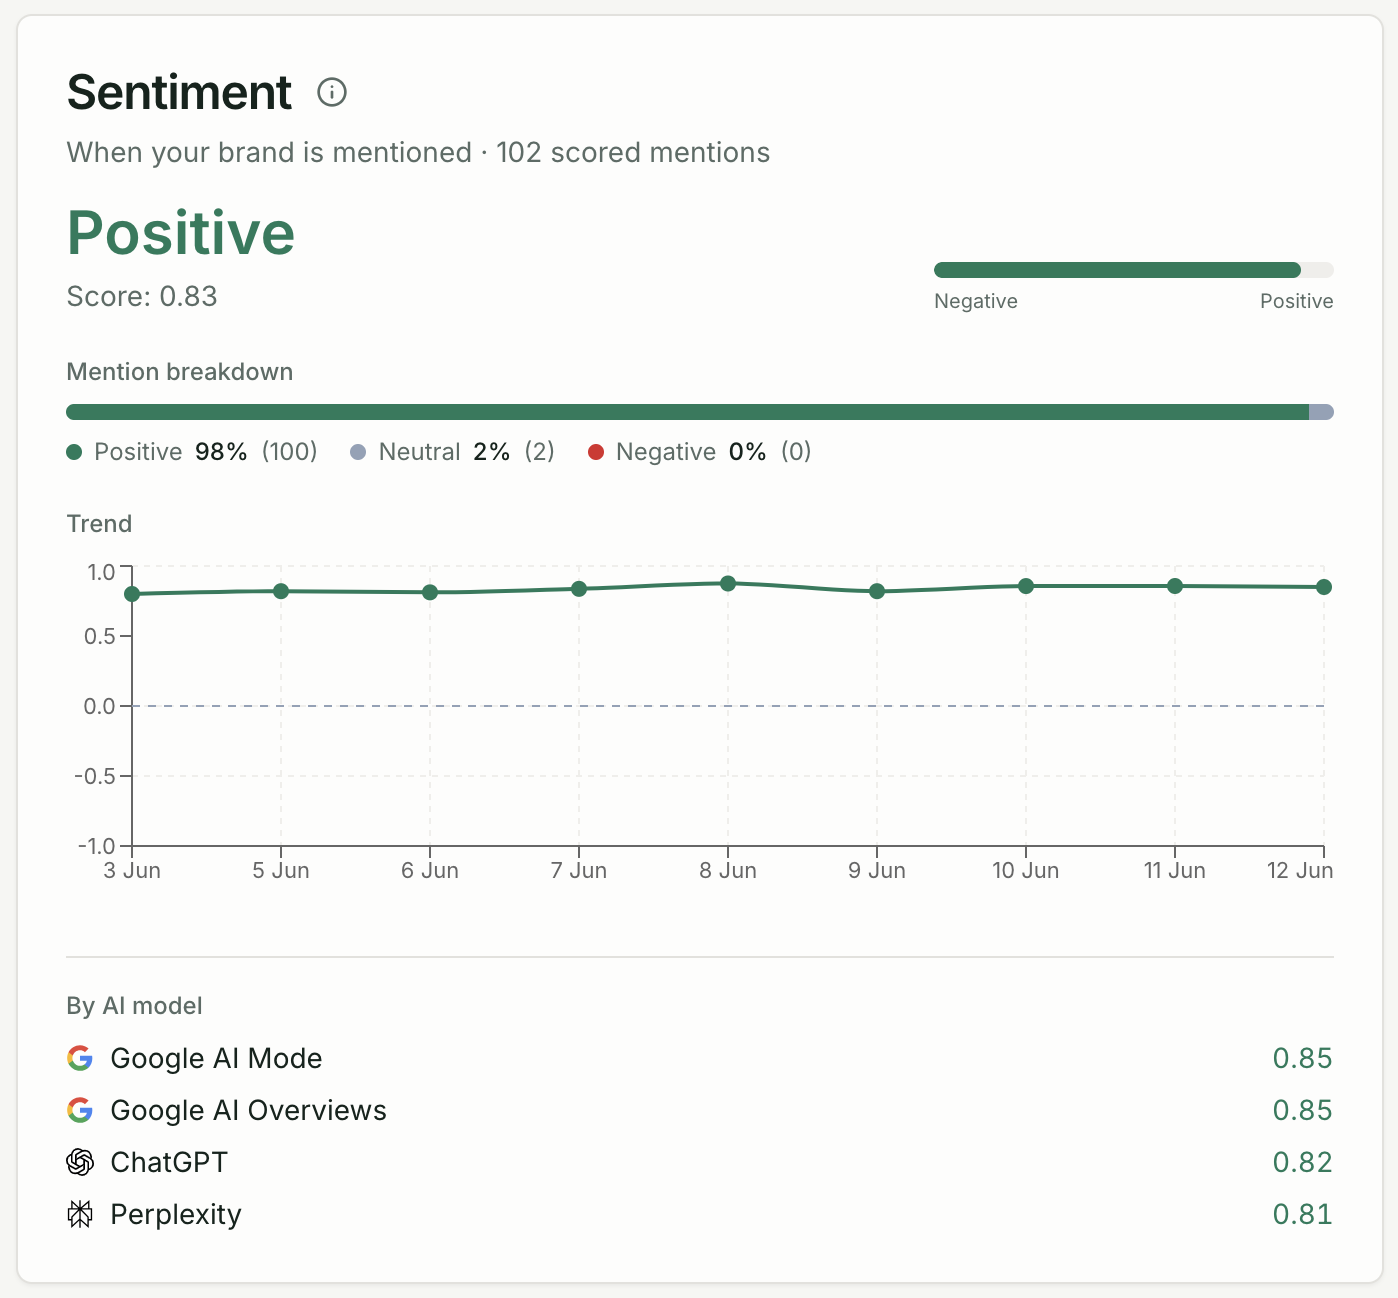
Section titled “Sentiment”Quratic classifies each AI response that mentions your brand into one of three categories:
| Sentiment | What it means |
|---|---|
| Positive | The AI describes your brand favourably — recommending it, highlighting strengths, or listing it as a top choice |
| Neutral | The AI mentions your brand factually without a clear positive or negative tone |
| Negative | The AI describes your brand unfavourably — noting weaknesses, comparing it negatively, or warning against it |
Where to find sentiment
Section titled “Where to find sentiment”- The Sentiment metric card on the Overview dashboard shows your aggregate sentiment split for the selected period
- The Prompts page shows per-prompt sentiment in the table
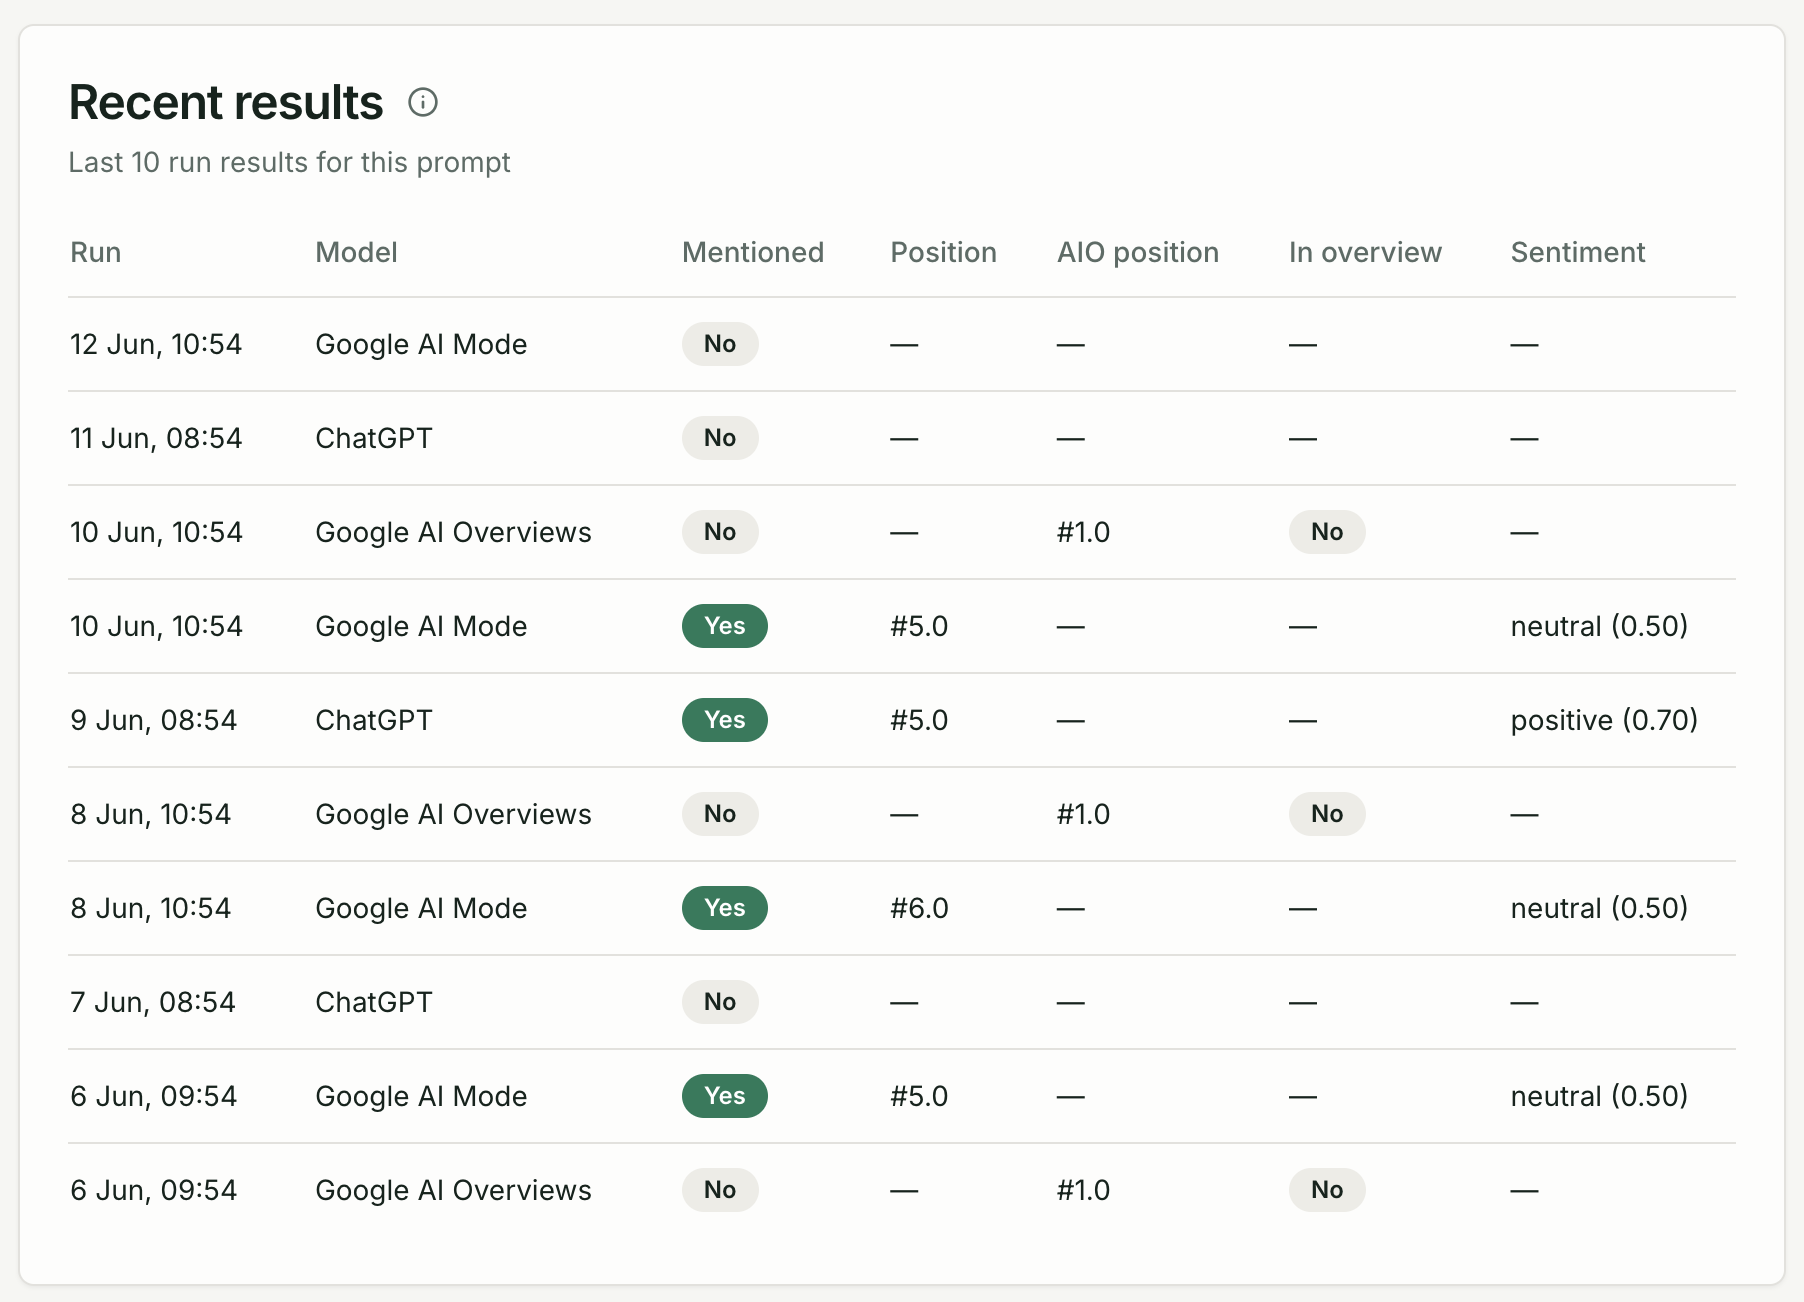
- The Prompt detail page shows sentiment per check result
- The Responses page shows sentiment per captured response
What affects sentiment
Section titled “What affects sentiment”Sentiment is derived from the language of the AI response. Factors that influence it:
- Content quality — authoritative, positively framed third-party content about your brand tends to improve AI sentiment over time
- Review presence — positive reviews on well-indexed platforms influence training data
- Competitive framing — if a query directly compares your brand to a competitor, the AI’s comparative language drives sentiment
Position
Section titled “Position”Position refers to where in the AI response your brand appears, on a 1–5 scale:
| Position | Interpretation |
|---|---|
| 1 | Your brand is the first or primary recommendation |
| 2–3 | Your brand is in the middle of a list or comparison |
| 4–5 | Your brand appears later, perhaps as a secondary mention |
Average position
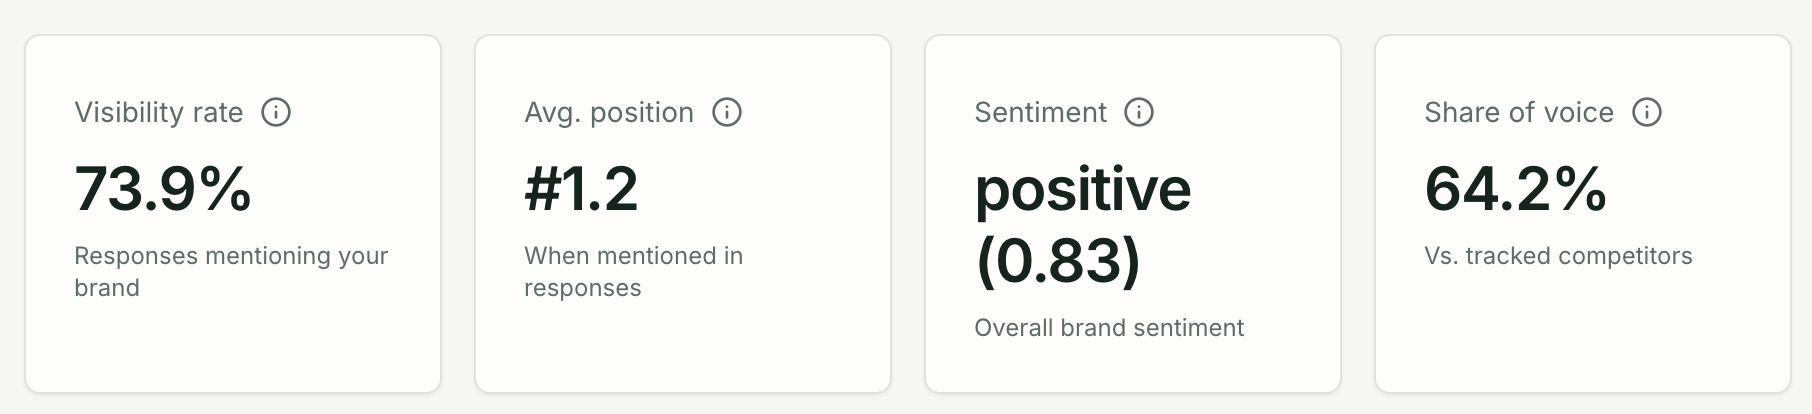
Section titled “Average position”The Avg. position metric card on the Overview dashboard shows your average position across all checks in the period where your brand appeared.
A lower average position is better — position 1 means you are consistently recommended first.
Position vs. share of voice
Section titled “Position vs. share of voice”| Metric | Measures |
|---|---|
| Share of Voice | Whether you appear (frequency) |
| Position | Where you appear (prominence) |
A brand with 60% SoV and average position 1 is consistently recommended first. A brand with 60% SoV and average position 4 appears often but is rarely the primary recommendation — a different kind of problem.