AI Models in the dashboard
The AI Models page breaks down your brand’s performance by AI platform — so you can see where you are strong and where competitors dominate.
Opening AI Models
Section titled “Opening AI Models”Click AI Models under AI Visibility in the sidebar.
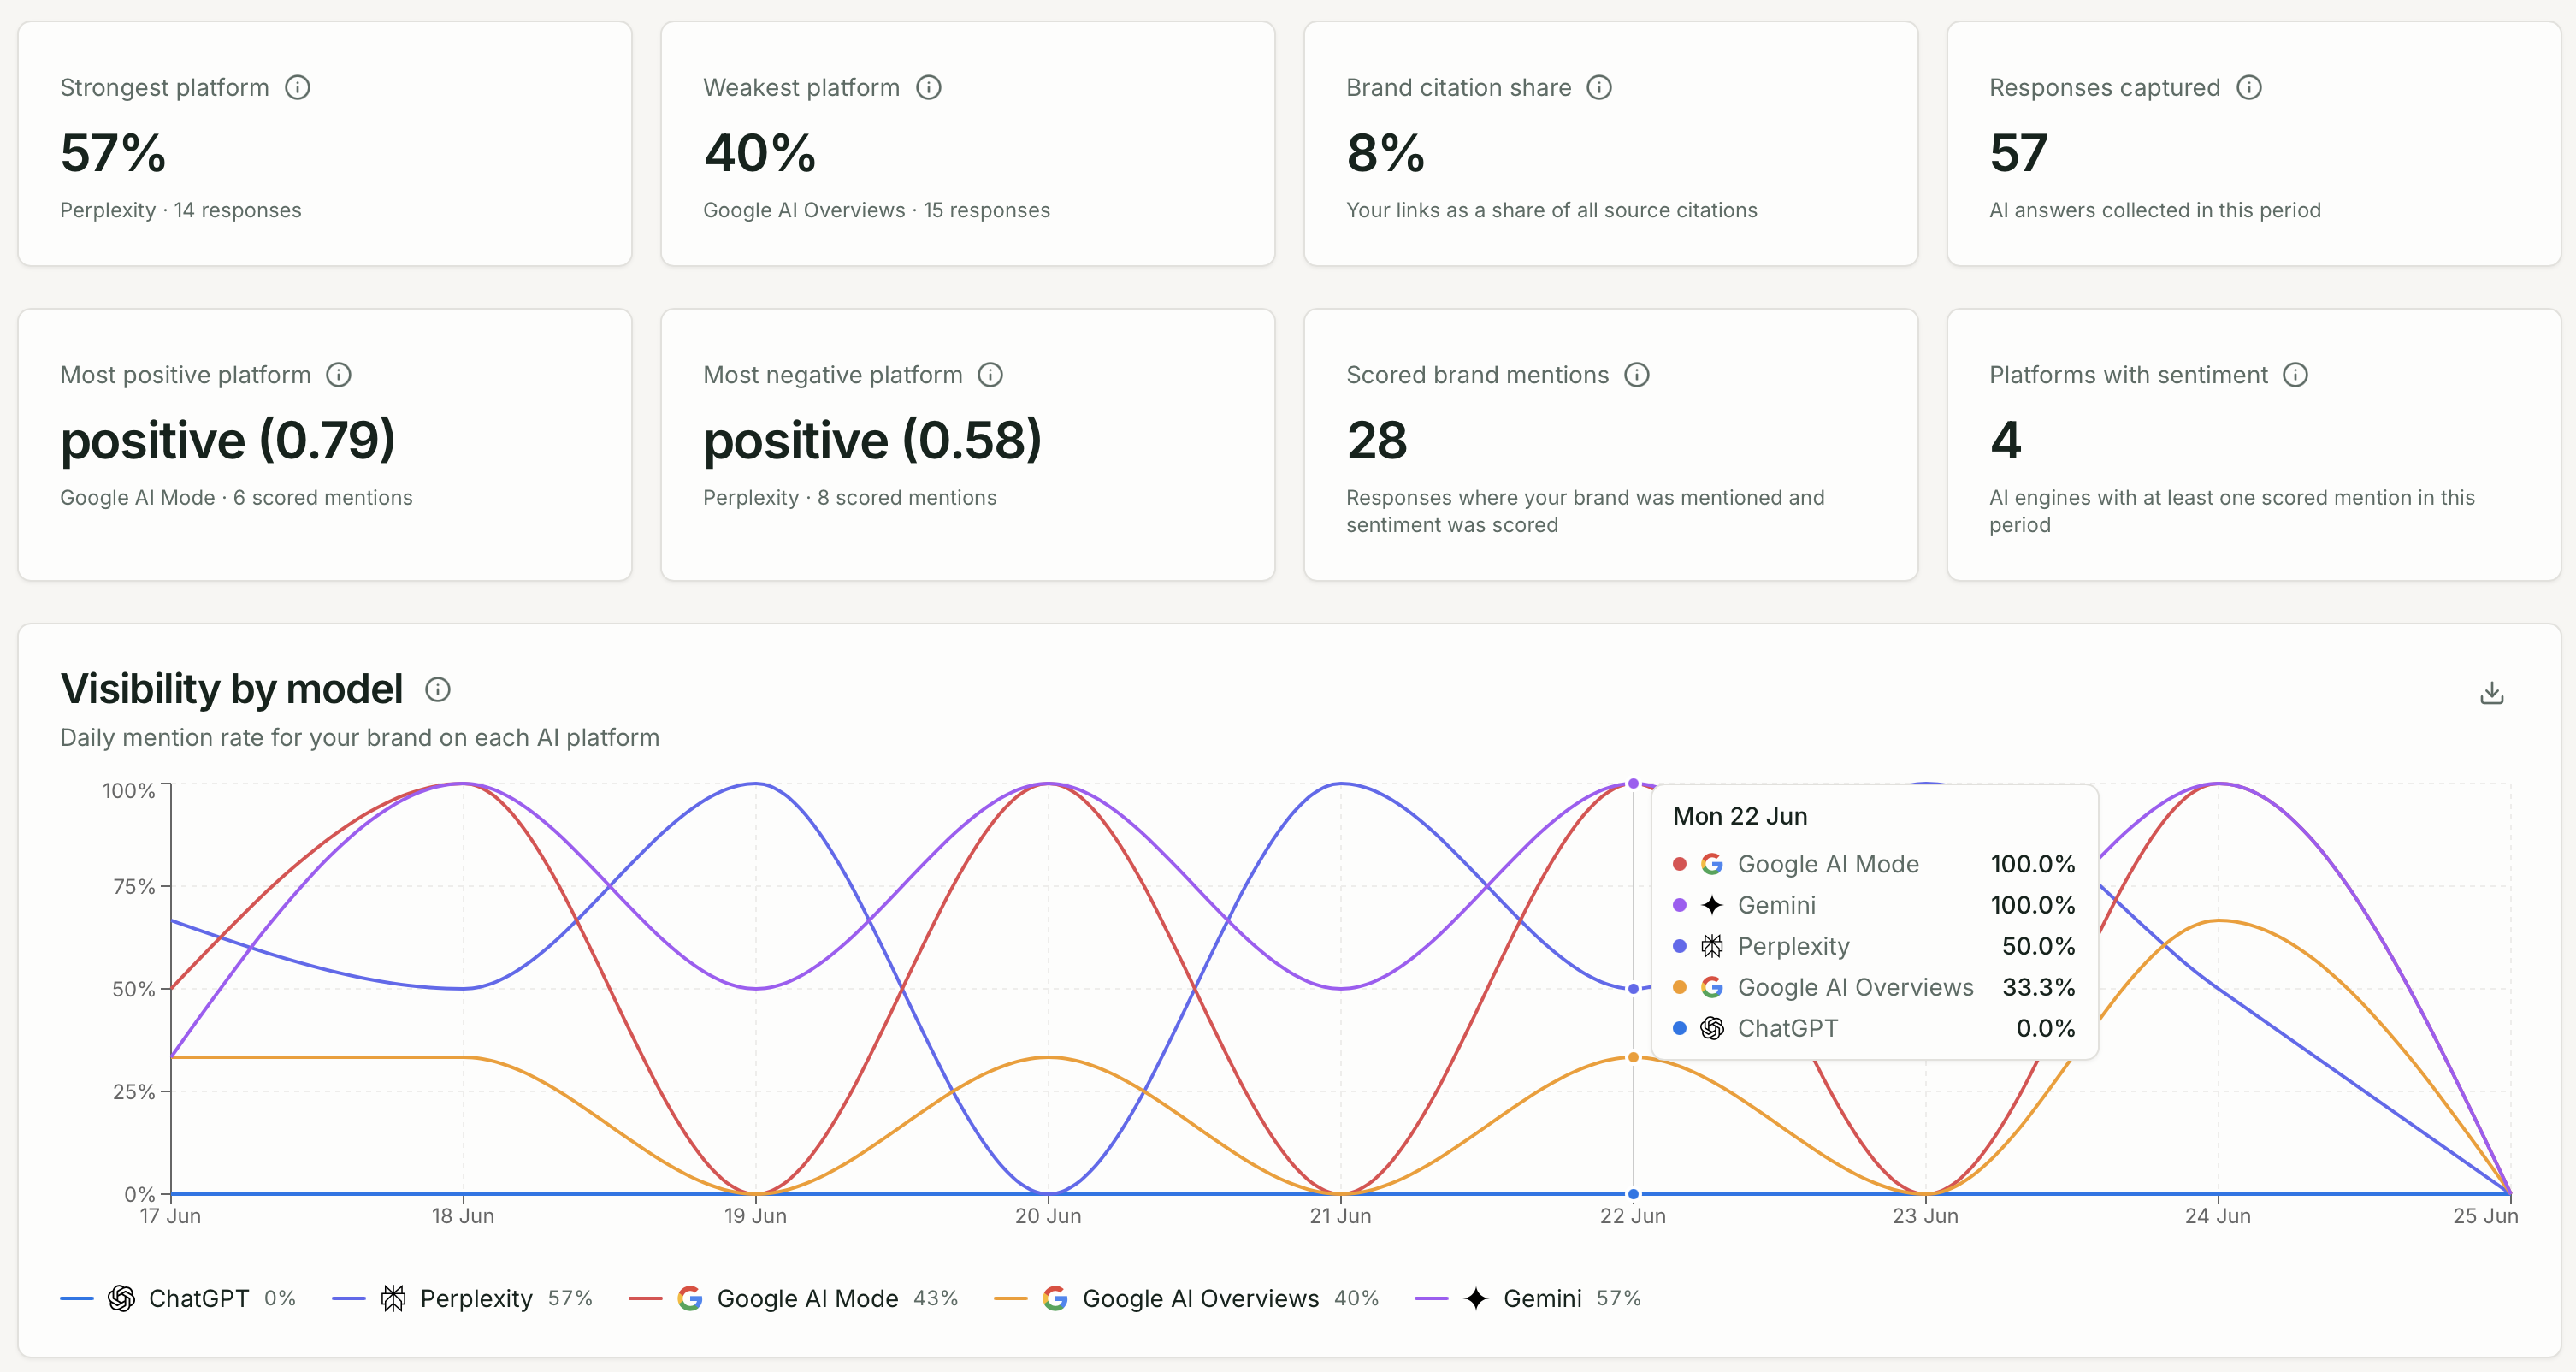
KPI cards
Section titled “KPI cards”| Metric | What it shows |
|---|---|
| Strongest platform | AI engine where your visibility rate is highest |
| Weakest platform | AI engine where your visibility rate is lowest |
| Brand citation share | Your citations as a share of all citations captured |
| Responses captured | Total AI responses in the selected period |
Platform scorecards
Section titled “Platform scorecards”Each active AI model gets a scorecard showing:
- Visibility rate and trend sparkline
- Sentiment mini-trend
- Brand citations count
- Top cited domains for that platform
Use scorecards to quickly compare ChatGPT vs. Perplexity vs. Gemini at a glance.
Charts
Section titled “Charts”- Visibility trend by model — line chart of mention rate per platform over time
- Sentiment trend by model — how sentiment shifts per platform
- Share of voice by model — competitor comparison filtered to one engine
Model breakdown table
Section titled “Model breakdown table”A detailed table with one row per AI platform:
| Column | Description |
|---|---|
| Visibility | Mention rate for the period |
| Change | Visibility delta vs. prior period |
| Share of voice | Your SoV on this platform |
| Leading competitor | Top competitor by mention rate |
| Brand citations | Links to your domain |
| Avg position | Average mention position |
| Sentiment mix | Positive / neutral / negative breakdown |
| Responses | Total captures |
| Citation links | Total source links in responses |
| Domains | Unique domains cited |
Click any row’s action links to open Responses, Citations, or Prompts filtered to that model.